The Circular Dorking Blog
2024 – The Best Ever Year for UK Renewable Energy
17th February 2025
There is a lot of gloom in the air for the UK at present…
…but let’s talk about some of the positives for a change.
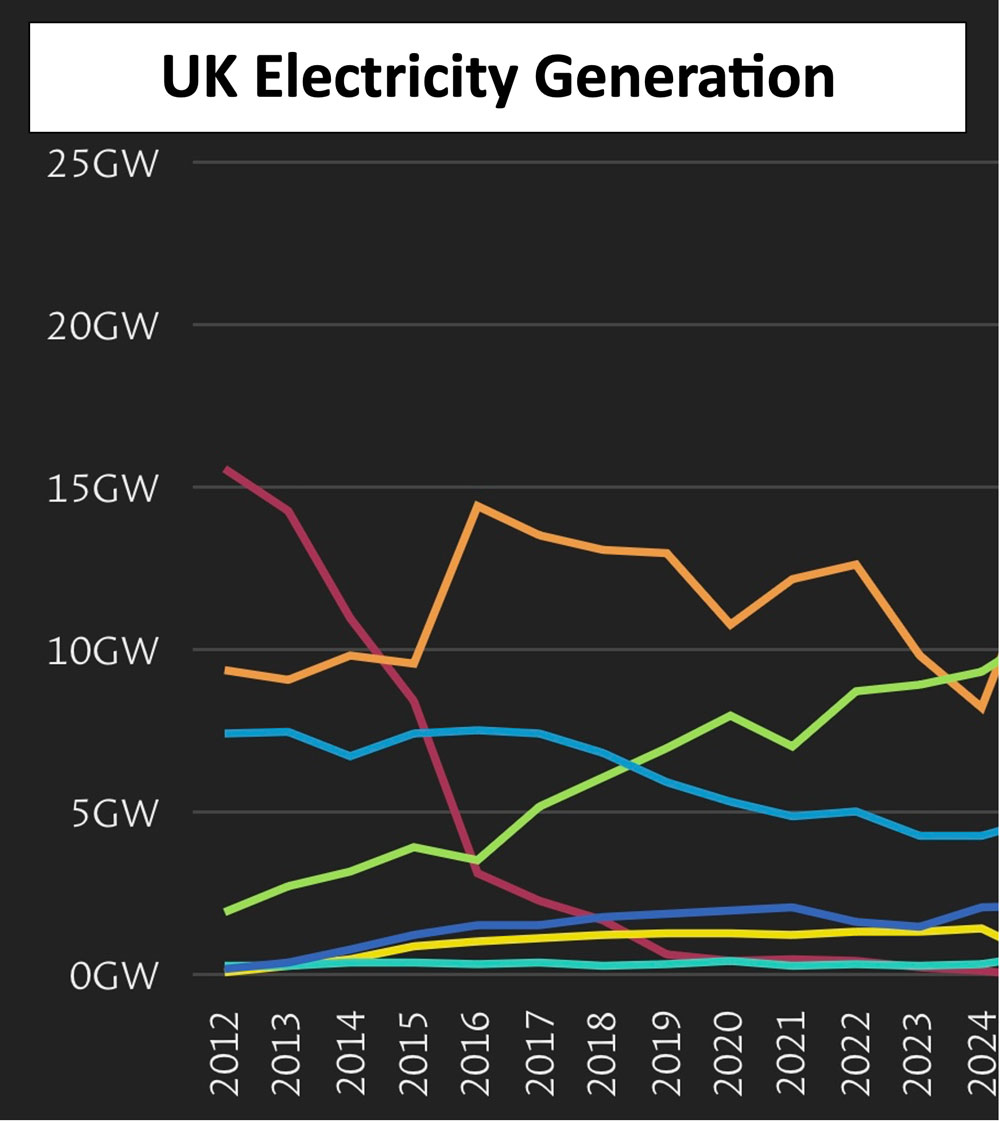
(Legend: red is coal based electricity generation, orange is natural gas, green is wind, light blue is nuclear, dark blue is biomass. yellow is solar photovoltaic, and cyan is hydroelectric)
The problem is the media focus on the negative new stories and we barely hear about the good stuff.
What has been achieved?
In 2024, United Kingdom grid electricity was generated as follows:
| Wind power (renewable energy) | 9.40 GW (Giga Watts on average throughout the year) | 36% |
| Natural gas (fossil fuel) | 8.29 GW | 32% |
| Low carbon grid imports from Europe | 3.75 GW | 14% |
| Biomass combustion | 2.34 GW | 9% |
| Solar (renewable energy) | 1.51 GW | 6% |
| Hydroelectric (renewable energy) | 0.41 GW | 2% |
| Coal power (fossil fuel) | 0.18 GW | 1% |
| Total | 25.88 GW (on average Jan – Dec 2024) | 100% |
Low carbon grid imports came from subsea cables from France (2.2GW), Norway (1.1GW), Belgium (0.4GW), Denmark (0.4GW), Netherlands (0.2GW).
Wind generation has grown 370% in the last 12 years. And coal has shunk from 16 GW to nothing in 12 years. All mainly due to policies set in place in the 2000’s decade.
Renewables generation was higher than fossil fuel generation for 44 out of 52 weeks of 2024.
In 2012 the carbon intensity of a unit of UK electricity was 505gCO2 per unit of electricity. But in 2024 is was 125g/CO2 per unit of electricity. That is a massive 75% reduction. So let’s be positive and amazed at what can be achieved.
Why is this important?
The UK is on a good trajectory for replacing a majority of its fossil fuel based electricity with low carbon and zero carbon electricity.
The challenge remains: property heating which is still mainly from natural gas and transportation which is still mainly from diesel and petrol. But there is gradual progress with electrification of property heating and transport. And as the graph shows, the right policies can take a decade to come to fruition.
How to get involved and help?
How about having a free home energy survey to help you reduce your energy bill and also be less carbon intensive.
Explore ideas on how to contribute to a more circular economy and less wasteful society. A win-win-win opportunity.
Data sources: Elexon Insights solution, National grid ESO data portal and carbon intensity API. Containing BMRS data @ Elexon Ltd copyright 2025. Via Kate Morley’s National Grid Live App.